Market Outlook
May 16, 2017
Market Cues
Domestic Indices
Chg (%)
(Pts)
(Close)
Indian markets are likely to open flat with a positive bias tracking the SGX Nifty and
BSE Sensex
0.4
134
30,322
Asian markets.
Nifty
0.5
44
9,445
Following the mixed performance seen last week, stocks moved mostly higher during
Mid Cap
1.3
186
15,040
trading on Monday. With upward move on the day, the tech heavy NASDAQ and
Small Cap
0.8
122
15,650
S&P once again climbed to new record closing highs. A significant increase in crude
oil prices generated buying interest in some counters.
Bankex
0.8
211
25,928
Majority of the European Indices ended with a positive bias and gained marginally.
Global Indices
Chg (%)
(Pts)
(Close)
While during the day they traded in narrow range, commodity related stocks and
Dow Jones
0.4
185
20,982
energy companies were in buying interest during the day. Oil prices saw an up
move and that seems helped in buying interest.
Nasdaq
0.5
28
6,150
FTSE
0.3
19
7,454
The Indian markets continued their upward. The IIP data on the revised series gave
Nikkei
(0.1)
(14)
19,870
healthier picture of the economy on one hand while on the other hand a favorable
Hang Seng
0.9
215
25,372
inflation data brought in renewed hope for a rate cut. Selective banks, pharma and
Shanghai Com
0.2
7
3,090
metal companies were in buying favor on Monday. With favorable macro outlook
and stable fund flows the bias for the market remains positive in the near term.
Advances / Declines
BSE
NSE
News Analysis
Advances
1,499
1,969
ICICI Bank Cuts home loan rate by upto 0.3% for loans upto `30lakhs
Declines
1,325
688
Detailed analysis on Pg2
Unchanged
182
101
Investor’s Ready Reckoner
Key Domestic & Global Indicators
Volumes (` Cr)
Stock Watch: Latest investment recommendations on 150+ stocks
BSE
3,472
Refer Pg6 onwards
NSE
22,917
Top Picks
CMP
Target
Upside
#Net Inflows (` Cr)
Net
Mtd
Ytd
Company
Sector
Rating
(`)
(`)
(%)
FII
(56916
( 2,319
44,331
Blue Star
Capital Goods
Accumulate
667
760
14.0
Dewan Housing Fin. Financials
Buy
431
520
20.5
MFs
(720)
2,655
23,337
Mahindra Lifespace Real Estate
Buy
449
522
16.1
Navkar Corporation Others
Buy
230
265
15.1
Top Gainers
Price (`)
Chg (%)
KEI Industries
Capital Goods
Accumulate
220
239
8.6
Peliacem
2,866
9.8
More Top Picks on Pg4
Network18
53
9.3
Key Upcoming Events
Welcorp
90
6.6
Previous
Consensus
Date
Region
Event Description
Adanitrans
95
6.5
Reading
Expectations
May 16, 2017 China
Industrial Production (YoY)
6.50
7.00
Hathway
42
6.3
May 16, 2017 US
Housing Starts
1,215.00
1,260.00
May 16, 2017 UK
CPI (YoY)
2.30
2.60
Top Losers
Price (`)
Chg (%)
May 16, 2017 US
Building permits
1,267.00
1,270.00
Idea
286
(7.0)
May 16, 2017 US
Industrial Production
0.55
0.40
Glenmark
716
(5.7)
May 17, 2017 Euro Zone Euro-Zone CPI (YoY)
1.90
1.90
More Events on Pg5
Suzlon
20
(5.5)
Ucobank
39
(5.3)
Southbank
25
(4.5)
#As on May 15, 2017
Market Outlook
May 16, 2017
News Analysis
ICICI Bank Cuts home loan rate by upto 0.3% for loans upto
`30lakhs
The good news for new home buyers continues to flow positively as; India’s
leading Pvt Sector lender ICICI Bank has reduced interest rates by upto 30 basis
point for home loans upto `30lakhs. As per the revised rates salaried women will
get home loans at 8.35% and others at 8.40%. Last week India’s largest bank SBI
had announced a 25 bps cut in its home loan rates from 8.6% to 8.35% p.a.
Home loans segment has been one of the safest lending space for both banks and
HFCs as the asset quality in this category continues to be strong. With the rate cut
by RBI the HFCs will also have to look forward to pass on some more benefit of
rate reduction to the users.
Though going ahead competition could intensify, we believe there is enough scope
for all banks and HFCs to grow in India. For ICICI Bank in particular, we believe
the move could aid to its growth momentum in the retail space. While the near
term asset quality will continue to be under pressure, directionally it is positive and
we have a positive view on the stock and recommend ACCMULATE on it.
Economic and Political News
Exports for April, 2017 rose by 20% for straight eight month to $ 24.6 Bn.
Petrol prices cut by `2.16/ litre and Diesel prices by `2.10/ litre
Govt plans multimodal logistics park with investments of `33,000 cr
Corporate News
TCS to commence buy back worth `16,000 cr from May 18,2017
HDFC Ltd also reduces its lending rates by 15 bps for women and 10 bps for
men for new home buyers
Vedanta posts Q4FY17 PAT of `1410 cr
Market Outlook
May 16, 2017
Quarterly Bloomberg Brokers Consensus Estimate
Tata Steel Ltd Consol - May 16, 2017
Particulars ( ` cr)
4QFY17E
4QFY16
y-o-y (%)
3QFY17
q-o-q (%)
Net sales
31,584
29,164
8.3
27,844
13.4
EBITDA
4,590
2,205
108.1
3,539
29.7
EBITDA margin (%)
14.5
7.6
12.7
Net profit
993
(356)
0.0
202
391.8
Punjab National Bank - May 16, 2017
Particulars ( ` cr)
4QFY17E
4QFY16
y-o-y (%)
3QFY17
q-o-q (%)
Net profit
472
(5,367)
0.0
207
127.7
United Breweries Ltd - May 17, 2017
Particulars ( ` cr)
4QFY17E
4QFY16
y-o-y (%)
3QFY17
q-o-q (%)
Net sales
1,163
1,185
(1.8)
979
18.8
EBITDA
125
125
(0.2)
128
(2.4)
EBITDA margin (%)
10.7
10.6
13.1
Net profit
48
51
(7.7)
48
(2.0)
JSW Steel Ltd Consol - May 17, 2017
Particulars ( ` cr)
4QFY17E
4QFY16
y-o-y (%)
3QFY17
q-o-q (%)
Net sales
16,730
10,471
59.8
13,798
21.3
EBITDA
3,039
1,825
66.6
2,867
6.0
EBITDA margin (%)
18.2
17.4
20.8
Net profit
773
170
354.2
730
5.8
Bajaj Finance - May 17, 2017
Particulars ( ` cr)
4QFY17E
4QFY16
y-o-y (%)
3QFY17
q-o-q (%)
Net profit
449
315
42.5
556
(23.8)
Hindustan Unilever Ltd - May 17, 2017
Particulars ( ` cr)
4QFY17E
4QFY16
y-o-y (%)
3QFY17
q-o-q (%)
Net sales
8,038
7,809
2.9
7,513
7.0
EBITDA
1,563
1,467
6.6
1,355
15.3
EBITDA margin (%)
19.5
18.8
18.0
Net profit
1,097
1,090
0.7
1,038
5.7
Market Outlook
May 16, 2017
Top Picks ★★★★★
Market Cap
CMP
Target
Upside
Company
Rationale
(` Cr)
(`)
(`)
(%)
Strong growth in domestic business due to its leadership
in acute therapeutic segment. Alkem expects to launch
Alkem Laboratories
22,910
1,916
2,257
17.8
more products in USA, which bodes for its international
business.
We expect the company would report strong profitability
Asian Granito
1,161
386
405
4.9
owing to better product mix, higher B2C sales and
amalgamation synergy..
Favourable outlook for the AC industry to augur well for
Cooling products business which is out pacing the market
Blue Star
6,373
667
760
14.0
growth. EMPPAC division's profitability to improve once
operating environment turns around..
With a focus on the low and medium income (LMI)
consumer segment, the company has increased its
Dewan Housing Finance
13,509
431
520
20.5
presence in tier-II & III cities where the growth opportunity
is immense.
Strong loan growth backed by diversified loan portfolio
and adequate CAR. ROE & ROA likely to remain decent
Equitas Holdings
5,505
163
235
44.2
as risk of dilution remains low. Attractive valuations
considering growth.
Economic recovery to have favourable impact on
advertising & circulation revenue growth. Further, the
Jagran Prakashan
6,327
194
225
16.2
acquisition of a radio business (Radio City) would also
boost the company's revenue growth.
High order book execution in EPC segment, rising B2C
KEI Industries
1,709
220
239
8.6
sales and higher exports to boost the revenues and
profitability
Speedier execution and speedier sales, strong revenue
Mahindra Lifespace
2,307
449
522
16.1
visibilty in short-to-long run, attractive valuations
Massive capacity expansion along with rail advantage at
Navkar Corporation
3,283
230
265
15.1
ICD as well CFS augurs well for the company
Strong brands and distribution network would boost
Siyaram Silk Mills
1,600
1,707
1,872
9.7
growth going ahead. Stock currently trades at an
inexpensive valuation.
Market leadership in Hindi news genre and no.
2
viewership ranking in English news genre, exit from the
TV Today Network
1,606
269
344
27.7
radio business, and anticipated growth in ad spends by
corporates to benefit the stock.
Source: Company, Angel Research
Market Outlook
May 16, 2017
Key Upcoming Events
Result Calendar
Date
Company
May 16, 2017
Punjab Natl.Bank, Andhra Bank, Tata Steel, Dishman Pharma, Transport Corporation of India
May 17, 2017
J K Lakshmi Cements, Allahabad Bank, HUL, NIIT, JSW Steel , UFO Moviez
Bajaj Auto, Automotive Axle, Cummins India, Bank of Baroda, Hindustan Media Ventures, Jyothy Laboratories, CESC,
May 18, 2017
Coffee Day Enterprises Ltd
Motherson Sumi, KEC International, HT Media, Electrosteel Castings, Abbott India, MM Forging, Elecon Engineering,
May 19, 2017
GSK Pharma, Tata Power Co., VRL Logistics
Source: Bloomberg, Angel Research
Global economic events release calendar
Date
Time
Country
Event Description
Unit
Period
Bloomberg Data
Last Reported Estimated
May 16, 2017 7:30AM China
Industrial Production (YoY)
% Change
Apr
6.50
7.00
6:00PM US
Housing Starts
Thousands
Apr
1,215.00
1,260.00
2:00PM UK
CPI (YoY)
% Change
Apr
2.30
2.60
6:00PM US
Building permits
Thousands
Apr
1,267.00
1,270.00
6:45PM US
Industrial Production
%
Apr
0.55
0.40
May 17, 2017 2:30PM Euro Zone
Euro-Zone CPI (YoY)
%
Apr F
1.90
1.90
2:00PM UK
Jobless claims change
% Change
Apr
25.50
--
May 18, 2017 6:00PM US
Initial Jobless claims
Thousands
May 13
236.00
240.00
May 19, 2017 7:30PM Euro Zone
Euro-Zone Consumer Confidence
Value
May A
(3.60)
(3.00)
May 23, 201711:30AM Germany
GDP nsa (YoY)
% Change
1Q F
2.90
--
7:30PM US
New home sales
Thousands
Apr
621.00
622.50
May 24, 2017 1:00PM Germany
PMI Services
Value
May P
55.40
--
1:00PM Germany
PMI Manufacturing
Value
May P
58.20
--
7:30PM US
Existing home sales
Million
Apr
5.71
5.67
May 25, 2017 6:00PM US
GDP Qoq (Annualised)
% Change
1Q S
0.70
0.90
May 26, 2017 2:00PM UK
GDP (YoY)
% Change
1Q P
2.10
--
May 30, 2017 7:30PM US
Consumer Confidence
S.A./ 1985=100
May
120.30
--
May 31, 2017 1:25PM Germany
Unemployment change (000's)
Thousands
May
(15.00)
--
6:30AM China
PMI Manufacturing
Value
May
51.20
--
Jun 1, 2017
2:00PM UK
PMI Manufacturing
Value
May
57.30
--
Jun 2, 2017
6:00PM US
Change in Nonfarm payrolls
Thousands
May
211.00
175.00
6:00PM US
Unnemployment rate
%
May
4.40
--
Source: Bloomberg, Angel Research
Market Outlook
May 16, 2017
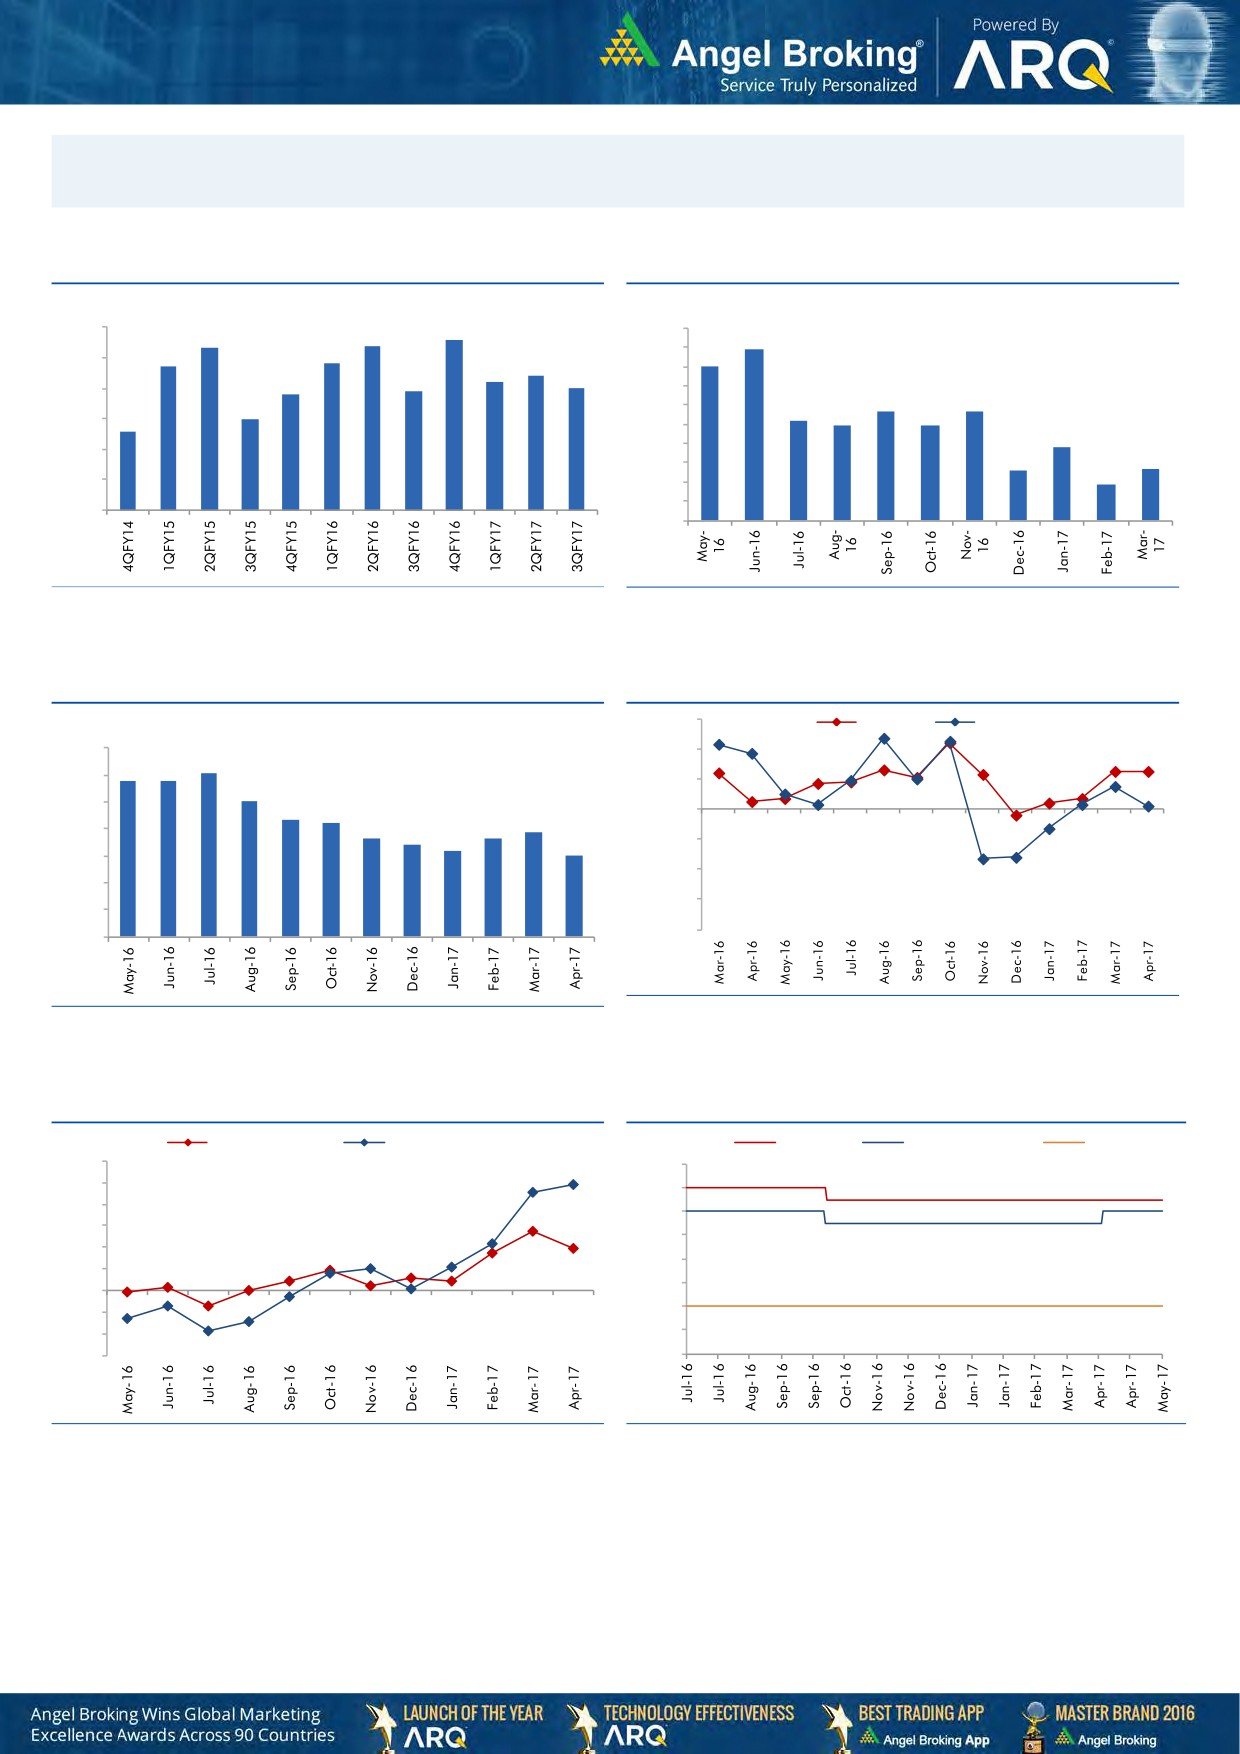
Macro watch
Exhibit 1: Quarterly GDP trends
Exhibit 2: IIP trends
(%)
(%)
8.6
9.0
8.3
8.4
10.0
8.9
7.7
7.8
9.0
8.0
8.0
7.4
7.2
8.0
6.9
7.0
6.8
7.0
7.0
5.7
5.7
6.0
6.0
5.2
5.6
4.9
4.9
6.0
5.0
3.8
5.0
4.0
2.6
2.7
3.0
1.9
4.0
2.0
1.0
3.0
-
Source: CSO, Angel Research
Source: MOSPI, Angel Research
Exhibit 3: Monthly CPI inflation trends
Exhibit 4: Manufacturing and services PMI
56.0
Mfg. PMI
Services PMI
(%)
7.0
54.0
6.1
5.8
5.8
6.0
52.0
5.1
5.0
4.3
4.2
50.0
3.9
3.6
3.7
4.0
3.4
3.2
3.0
48.0
3.0
46.0
2.0
44.0
1.0
42.0
-
Source: Market, Angel Research; Note: Level above 50 indicates expansion
Source: MOSPI, Angel Research
Exhibit 5: Exports and imports growth trends
Exhibit 6: Key policy rates
(%)
Exports yoy growth
Imports yoy growth
(%)
Repo rate
Reverse Repo rate
CRR
60.0
7.00
50.0
6.50
40.0
6.00
30.0
5.50
20.0
5.00
10.0
4.50
0.0
4.00
(10.0)
(20.0)
3.50
(30.0)
3.00
Source: Bloomberg, Angel Research
Source: RBI, Angel Research
Market Outlook
May 16, 2017
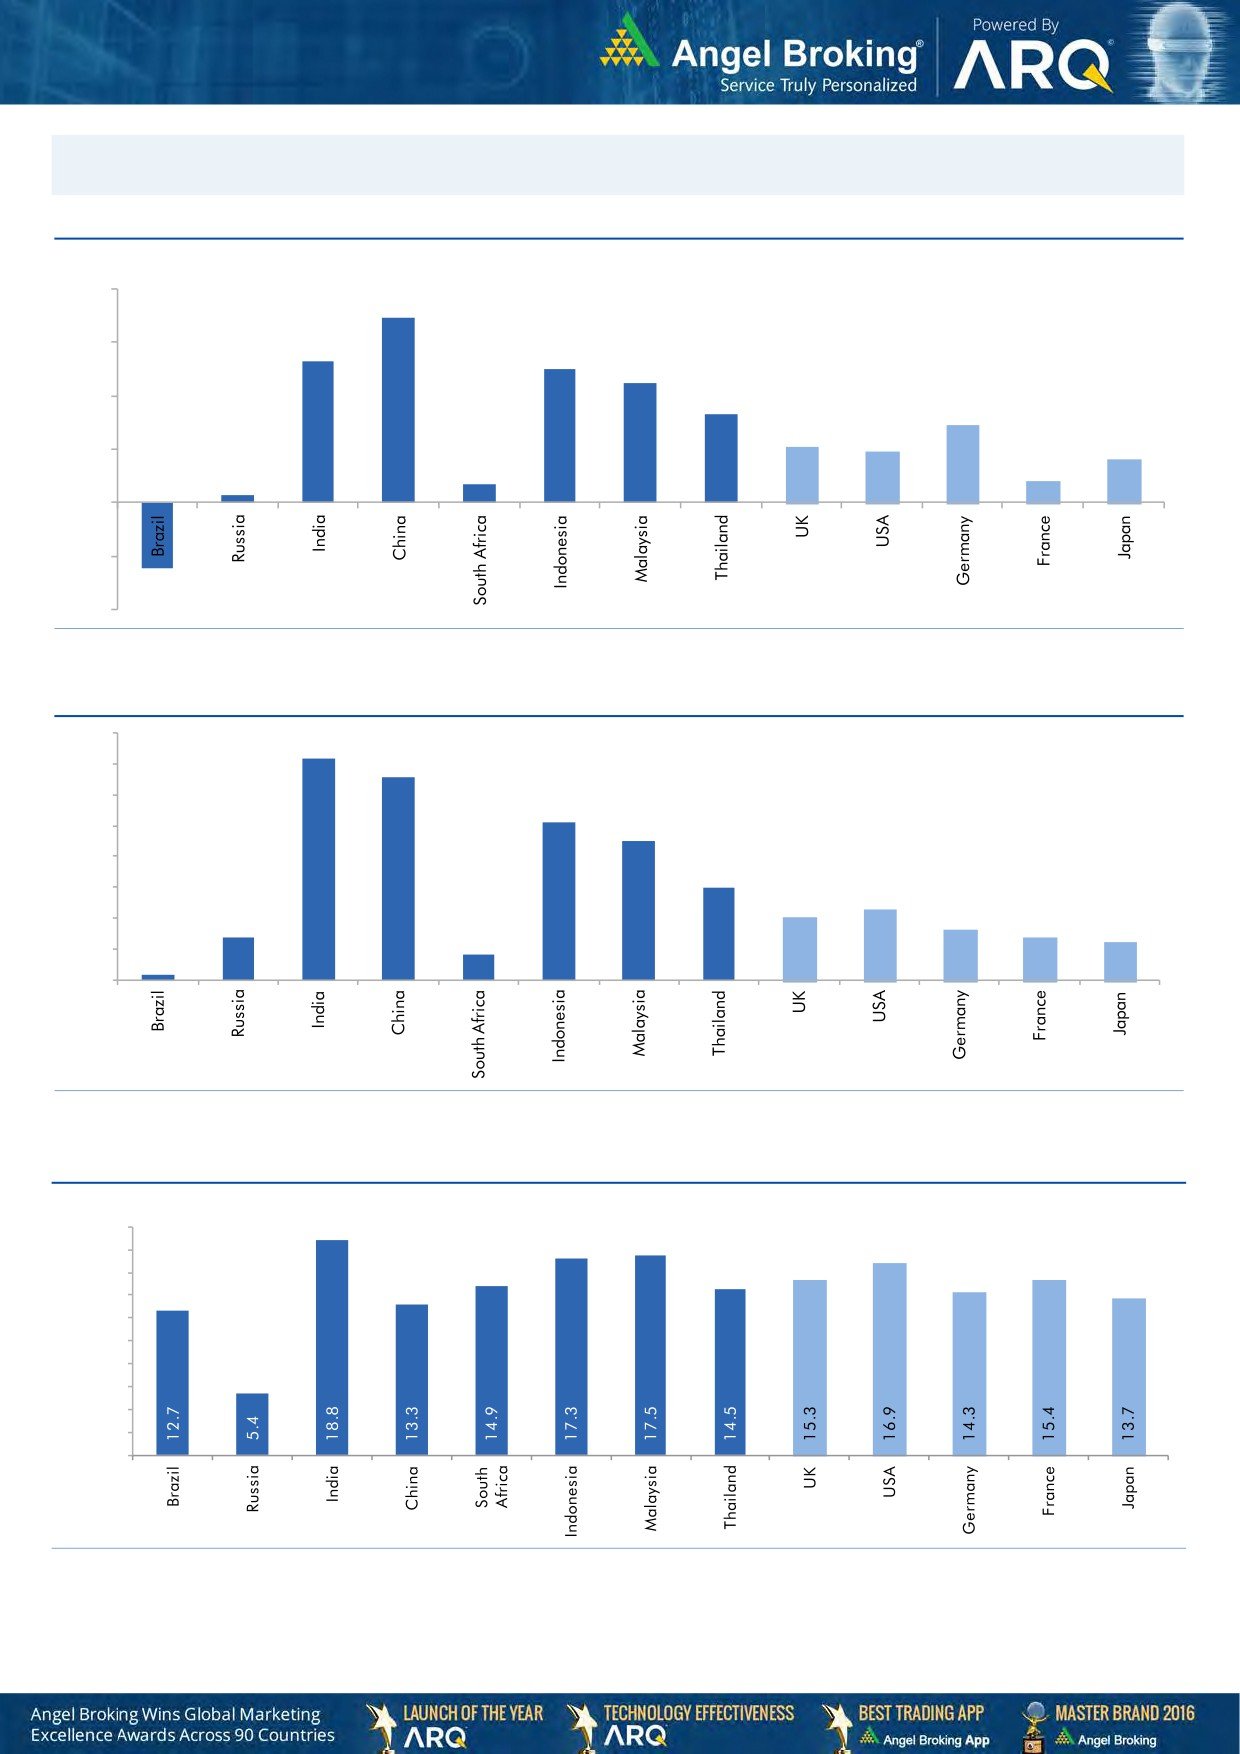
Global watch
Exhibit 1: Latest quarterly GDP Growth (%, yoy) across select developing and developed countries
(%)
8.0
6.9
6.0
5.3
5.0
0.7
4.5
4.0
3.3
2.9
2.1
1.9
2.0
0.3
1.6
0.8
-
(2.0)
(2.5)
(4.0)
Source: Bloomberg, Angel Research
Exhibit 2: 2016 GDP Growth projection by IMF (%, yoy) across select developing and developed countries
(%)
7.2
7.0
6.6
6.0
5.1
5.0
4.5
4.0
3.0
3.0
2.3
2.0
1.4
1.6
2.0
1.4
1.2
0.2
0.8
1.0
-
Source: IMF, Angel Research
Exhibit 3: One year forward P-E ratio across select developing and developed countries
(x)
20.0
18.0
16.0
14.0
12.0
10.0
8.0
6.0
4.0
2.0
-
Source: IMF, Angel Research
Market Outlook
May 16, 2017
Exhibit 4: Relative performance of indices across globe
Returns (%)
Country
Name of index
Closing price
1M
3M
1YR
Brazil
Bovespa
68,474
5.9
6.7
29.8
Russia
Micex
2,003
1.6
(9.7)
4.9
India
Nifty
9,445
2.3
7.7
19.7
China
Shanghai Composite
3,090
(6.4)
(4.1)
2.5
South Africa
Top 40
47,437
2.9
4.6
3.5
Mexico
Mexbol
49,679
0.3
5.9
8.4
Indonesia
LQ45
952
1.2
5.5
14.7
Malaysia
KLCI
1,779
2.5
4.7
7.8
Thailand
SET 50
981
(2.2)
(1.6)
10.6
USA
Dow Jones
20,982
1.9
3.5
18.5
UK
FTSE
7,454
1.4
3.1
20.9
Japan
Nikkei
19,870
5.7
4.5
23.4
Germany
DAX
12,807
5.0
10.0
29.2
France
CAC
5,417
6.1
12.2
25.3
Source: Bloomberg, Angel Research
Stock Watch
May 16, 2017
Company Name
Reco
CMP
Target
Mkt Cap
Sales ( Čcr )
OPM(%)
EPS (Č)
PER(x)
P/BV(x)
RoE(%)
EV/Sales(x)
(Č)
Price ( Č)
( Č cr )
FY17E
FY18E
FY17E
FY18E
FY17E
FY18E
FY17E
FY18E
FY17E
FY18E
FY17E
FY18E
FY17E
FY18E
Agri / Agri Chemical
Rallis
Neutral
247
-
4,799
1,937
2,164
13.3
14.3
9.0
11.0
27.4
22.4
4.8
4.2
18.4
19.8
2.5
2.2
United Phosphorus
Neutral
836
-
42,446
15,176
17,604
18.5
18.5
37.4
44.6
22.3
18.7
4.4
3.6
21.4
21.2
2.9
2.5
Auto & Auto Ancillary
Amara Raja Batteries
Accumulate
930
1,009
15,891
5,305
6,100
16.0
16.3
28.4
34.0
32.8
27.4
6.3
5.3
19.3
19.3
3.0
2.6
Apollo Tyres
Neutral
232
-
11,817
12,877
14,504
14.3
13.9
21.4
23.0
10.8
10.1
1.7
1.5
16.4
15.2
1.1
1.0
Ashok Leyland
Buy
86
111
24,531
20,021
21,915
11.6
11.9
4.5
5.3
19.2
16.2
3.9
3.5
20.6
21.5
1.2
1.0
Bajaj Auto
Neutral
2,992
-
86,587
25,093
27,891
19.5
19.2
143.9
162.5
20.8
18.4
5.8
5.0
30.3
29.4
3.2
2.8
Bharat Forge
Neutral
1,122
-
26,113
7,726
8,713
20.5
21.2
35.3
42.7
31.8
26.3
5.9
5.3
18.9
20.1
3.4
3.0
Ceat
Neutral
1,636
-
6,616
7,524
8,624
13.0
12.7
131.1
144.3
12.5
11.3
2.3
2.0
19.8
18.6
1.0
0.8
Eicher Motors
Neutral
28,931
-
78,721
16,583
20,447
17.5
18.0
598.0
745.2
48.4
38.8
16.5
12.6
41.2
38.3
4.6
3.6
Exide Industries
Neutral
246
-
20,940
7,439
8,307
15.0
15.0
8.1
9.3
30.4
26.5
4.3
3.8
14.3
16.7
2.4
2.2
Gabriel India
Neutral
128
-
1,835
1,544
1,715
9.0
9.3
5.4
6.3
23.7
20.3
4.5
4.0
18.9
19.5
1.1
1.0
Hero Motocorp
Neutral
3,517
-
70,239
28,083
30,096
15.3
15.7
171.8
187.0
20.5
18.8
7.1
6.0
30.1
27.9
2.3
2.1
Indag Rubber
Neutral
213
-
559
286
326
19.8
16.8
11.7
13.3
18.2
16.0
3.1
2.9
17.8
17.1
1.6
1.4
Jamna Auto Industries
Neutral
241
-
1,918
1,486
1,620
9.8
9.9
15.0
17.2
16.1
14.0
3.5
3.0
21.8
21.3
1.4
1.2
JK Tyres
Neutral
169
-
3,832
7,455
8,056
15.0
15.0
21.8
24.5
7.8
6.9
1.6
1.3
22.8
21.3
0.6
0.6
L G Balakrishnan & Bros Neutral
684
-
1,074
1,302
1,432
11.6
11.9
43.7
53.0
15.7
12.9
2.2
2.0
13.8
14.2
0.9
0.8
Mahindra and Mahindra Neutral
1,376
-
85,478
46,534
53,077
11.6
11.7
67.3
78.1
20.4
17.6
3.3
2.9
15.4
15.8
1.8
1.6
Maruti
Neutral
6,813
-
205,797
67,822
83,288
16.0
16.4
253.8
312.4
26.8
21.8
6.2
5.0
23.0
22.9
2.7
2.1
Minda Industries
Neutral
518
-
4,476
2,728
3,042
9.0
9.1
68.2
86.2
7.6
6.0
1.7
1.4
23.8
24.3
1.7
1.5
Motherson Sumi
Neutral
417
-
58,515
45,896
53,687
7.8
8.3
13.0
16.1
32.0
25.9
10.3
8.2
34.7
35.4
1.3
1.1
Rane Brake Lining
Neutral
1,021
-
808
511
562
11.3
11.5
28.1
30.9
36.3
33.0
5.5
5.0
15.3
15.0
1.7
1.6
Setco Automotive
Neutral
41
-
548
741
837
13.0
13.0
15.2
17.0
2.7
2.4
0.4
0.4
15.8
16.3
1.1
1.0
Subros
Neutral
248
-
1,489
1,488
1,681
11.7
11.9
6.4
7.2
38.8
34.6
4.1
3.7
10.8
11.4
1.2
1.1
Swaraj Engines
Neutral
1,858
-
2,308
660
810
15.2
16.4
54.5
72.8
34.1
25.5
10.6
9.6
31.5
39.2
3.3
2.7
Tata Motors
Neutral
432
-
124,690
300,209
338,549
8.9
8.4
42.7
54.3
10.1
8.0
1.6
1.4
15.6
17.2
0.5
0.5
TVS Motor
Neutral
525
-
24,925
13,390
15,948
6.9
7.1
12.8
16.5
41.1
31.7
10.2
8.1
26.3
27.2
1.9
1.6
Capital Goods
ACE
Neutral
67
-
666
709
814
4.1
4.6
1.4
2.1
48.1
32.1
2.0
1.9
4.4
6.0
1.1
1.0
BEML
Neutral
1,363
-
5,676
3,451
4,055
6.3
9.2
31.4
57.9
43.4
23.5
2.6
2.4
6.3
10.9
1.8
1.5
BGR Energy
Neutral
175
-
1,262
16,567
33,848
6.0
5.6
7.8
5.9
22.4
29.6
1.3
1.2
4.7
4.2
0.2
0.1
Stock Watch
May 16, 2017
Company Name
Reco
CMP
Target
Mkt Cap
Sales ( Čcr )
OPM(%)
EPS (Č)
PER(x)
P/BV(x)
RoE(%)
EV/Sales(x)
(Č)
Price ( Č)
( Č cr )
FY17E
FY18E
FY17E
FY18E
FY17E
FY18E
FY17E
FY18E
FY17E
FY18E
FY17E
FY18E
FY17E
FY18E
Capital Goods
Bharat Electronics
Neutral
180
-
40,194
8,137
9,169
16.8
17.2
58.7
62.5
3.1
2.9
0.5
0.4
44.6
46.3
3.9
3.5
BHEL
Neutral
172
-
42,099
28,797
34,742
-
2.8
2.3
6.9
74.8
24.9
1.3
1.2
1.3
4.8
1.1
0.8
Blue Star
Accumulate
667
760
6,373
4,283
5,077
5.9
7.3
14.9
22.1
44.8
30.1
8.7
7.3
20.4
26.4
1.5
1.3
CG Power and Industrial
Neutral
94
-
5,920
5,777
6,120
5.9
7.0
3.3
4.5
28.6
21.0
1.3
1.2
4.4
5.9
1.0
0.8
Solutions
Greaves Cotton
Neutral
156
-
3,817
1,755
1,881
16.8
16.9
7.8
8.5
20.0
18.4
4.0
3.7
20.6
20.9
1.9
1.7
Inox Wind
Neutral
167
-
3,698
5,605
6,267
15.7
16.4
24.8
30.0
6.7
5.6
1.9
1.4
25.9
24.4
0.7
0.6
KEC International
Neutral
231
-
5,940
9,294
10,186
7.9
8.1
9.9
11.9
23.3
19.4
3.4
3.0
15.6
16.3
0.9
0.8
KEI Industries
Accumulate
220
239
1,709
2,682
3,058
10.4
10.0
11.7
12.8
18.7
17.2
3.8
3.1
20.1
18.2
0.8
0.7
Thermax
Neutral
1,029
-
12,259
5,421
5,940
7.3
7.3
25.7
30.2
40.0
34.1
4.8
4.4
12.2
13.1
2.1
2.0
VATech Wabag
Neutral
668
-
3,648
3,136
3,845
8.9
9.1
26.0
35.9
25.7
18.6
3.2
2.7
13.4
15.9
1.1
0.8
Voltas
Neutral
432
-
14,309
6,511
7,514
7.9
8.7
12.9
16.3
33.5
26.5
6.0
5.3
16.7
18.5
2.0
1.7
Cement
ACC
Neutral
1,682
-
31,587
11,225
13,172
13.2
16.9
44.5
75.5
37.8
22.3
3.6
3.3
11.2
14.2
2.8
2.4
Ambuja Cements
Neutral
258
-
51,269
9,350
10,979
18.2
22.5
5.8
9.5
44.5
27.2
3.7
3.4
10.2
12.5
5.5
4.7
India Cements
Neutral
220
-
6,766
4,364
4,997
18.5
19.2
7.9
11.3
27.9
19.5
2.0
2.0
8.0
8.5
2.3
2.0
J K Lakshmi Cement
Neutral
511
-
6,008
2,913
3,412
14.5
19.5
7.5
22.5
68.1
22.7
4.2
3.5
12.5
18.0
2.7
2.2
JK Cement
Neutral
1,116
-
7,805
4,398
5,173
15.5
17.5
31.2
55.5
35.8
20.1
4.3
3.7
12.0
15.5
2.3
1.9
Orient Cement
Neutral
165
-
3,382
2,114
2,558
18.5
20.5
8.1
11.3
20.4
14.6
3.0
2.5
9.0
14.0
2.2
1.7
UltraTech Cement
Neutral
4,432
-
121,654
25,768
30,385
21.0
23.5
111.0
160.0
39.9
27.7
5.1
4.5
13.5
15.8
4.8
4.0
Construction
Engineers India
Neutral
169
-
11,368
1,725
1,935
16.0
19.1
11.4
13.9
14.8
12.1
2.0
2.0
13.4
15.3
5.5
4.9
Gujarat Pipavav Port
Neutral
159
-
7,672
705
788
52.2
51.7
5.0
5.6
31.7
28.3
3.1
2.8
11.2
11.2
10.5
8.9
ITNL
Neutral
118
-
3,869
8,946
10,017
31.0
31.6
8.1
9.1
14.5
12.9
0.5
0.5
4.2
5.0
3.8
3.5
KNR Constructions
Neutral
211
-
2,973
1,385
1,673
14.7
14.0
41.2
48.5
5.1
4.4
1.0
0.8
14.9
15.2
2.2
1.8
Larsen & Toubro
Neutral
1,738
-
162,231
111,017
124,908
11.0
11.0
61.1
66.7
28.5
26.1
3.4
3.2
13.1
12.9
2.5
2.3
MEP Infra
Neutral
73
-
1,191
1,877
1,943
30.6
29.8
3.0
4.2
24.4
17.4
11.8
8.0
0.6
0.6
2.0
1.8
Nagarjuna Const.
Neutral
97
-
5,404
8,842
9,775
9.1
8.8
5.3
6.4
18.3
15.2
1.5
1.3
8.2
9.1
0.8
0.7
NBCC
Neutral
198
-
17,784
7,428
9,549
7.9
8.6
8.2
11.0
24.1
18.0
1.2
1.0
28.2
28.7
2.1
1.6
PNC Infratech
Neutral
159
-
4,088
2,350
2,904
13.1
13.2
9.0
8.8
17.7
18.1
0.7
0.6
15.9
13.9
1.9
1.5
Power Mech Projects
Neutral
590
-
868
1,801
2,219
12.7
14.6
72.1
113.9
8.2
5.2
1.5
1.3
16.8
11.9
0.5
0.4
Sadbhav Engineering
Neutral
343
-
5,880
3,598
4,140
10.3
10.6
9.0
11.9
38.1
28.8
4.0
3.5
9.9
11.9
1.9
1.6
Stock Watch
May 16, 2017
Company Name
Reco
CMP
Target
Mkt Cap
Sales ( Čcr )
OPM(%)
EPS (Č)
PER(x)
P/BV(x)
RoE(%)
EV/Sales(x)
(Č)
Price ( Č)
( Č cr )
FY17E
FY18E
FY17E
FY18E
FY17E
FY18E
FY17E
FY18E
FY17E
FY18E
FY17E
FY18E
FY17E
FY18E
Construction
Simplex Infra
Neutral
411
-
2,032
6,829
7,954
10.5
10.5
31.4
37.4
13.1
11.0
1.4
1.2
9.9
13.4
0.7
0.6
SIPL
Neutral
112
-
3,955
1,036
1,252
65.5
66.2
(8.4)
(5.6)
4.2
4.8
(22.8)
(15.9)
12.0
10.0
Financials
Axis Bank
Buy
500
580
119,823
46,932
53,575
3.5
3.4
32.4
44.6
15.5
11.2
2.0
1.7
13.6
16.5
-
-
Bank of Baroda
Neutral
189
-
43,468
19,980
23,178
1.8
1.8
11.5
17.3
16.4
10.9
1.9
1.6
8.3
10.1
-
-
Can Fin Homes
Neutral
2,782
-
7,407
420
526
3.5
3.5
86.5
107.8
32.2
25.8
6.9
5.7
23.6
24.1
-
-
Canara Bank
Neutral
364
-
21,741
15,225
16,836
1.8
1.8
14.5
28.0
25.1
13.0
1.7
1.4
5.8
8.5
-
-
Cholamandalam Inv. &
Buy
1,050
1,230
16,404
2,012
2,317
6.3
6.3
42.7
53.6
24.6
19.6
3.9
3.3
16.9
18.3
-
-
Fin. Co.
Dewan Housing Finance Buy
431
520
13,509
2,225
2,688
2.9
2.9
29.7
34.6
14.5
12.5
2.3
1.5
16.1
14.8
-
-
Equitas Holdings
Buy
163
235
5,505
939
1,281
11.7
11.5
5.8
8.2
28.1
19.9
2.4
2.2
10.9
11.5
-
-
Federal Bank
Accumulate
117
125
20,183
8,259
8,995
3.0
3.0
4.3
5.6
27.2
20.9
2.3
2.1
8.5
10.1
-
-
HDFC
Neutral
1,559
-
247,617
11,475
13,450
3.4
3.4
45.3
52.5
34.4
29.7
6.6
5.9
20.2
20.5
-
-
HDFC Bank
Accumulate
1,555
1,650
398,895
46,097
55,433
4.5
4.5
58.4
68.0
26.6
22.9
4.7
3.9
18.8
18.6
-
-
ICICI Bank
Neutral
302
-
175,962
42,800
44,686
3.1
3.3
18.0
21.9
16.8
13.8
2.3
2.1
11.1
12.3
-
-
Karur Vysya Bank
Buy
117
140
7,098
5,640
6,030
3.3
3.2
8.9
10.0
13.2
11.8
1.4
1.3
11.2
11.4
-
-
Lakshmi Vilas Bank
Neutral
190
-
3,638
3,339
3,799
2.7
2.8
11.0
14.0
17.3
13.6
1.8
1.6
11.2
12.7
-
-
LIC Housing Finance
Neutral
686
-
34,610
3,712
4,293
2.6
2.5
39.0
46.0
17.6
14.9
3.3
2.8
19.9
20.1
-
-
Punjab Natl.Bank
Neutral
167
-
35,526
23,532
23,595
2.3
2.4
6.8
12.6
24.6
13.3
3.8
2.7
3.3
6.5
-
-
RBL Bank
Neutral
564
-
21,158
1,783
2,309
2.6
2.6
12.7
16.4
44.4
34.4
4.8
4.3
12.8
13.3
-
-
Repco Home Finance
Accumulate
754
825
4,719
388
457
4.5
4.2
30.0
38.0
25.1
19.9
4.2
3.5
18.0
19.2
-
-
South Ind.Bank
Neutral
25
-
4,444
6,435
7,578
2.5
2.5
2.7
3.1
9.1
8.0
1.2
1.0
10.1
11.2
-
-
St Bk of India
Neutral
300
-
243,661
88,650
98,335
2.6
2.6
13.5
18.8
22.3
16.0
2.1
1.9
7.0
8.5
-
-
Union Bank
Neutral
174
-
11,955
13,450
14,925
2.3
2.3
25.5
34.5
6.8
5.0
1.0
0.9
7.5
10.2
-
-
Yes Bank
Neutral
1,472
-
67,199
8,978
11,281
3.3
3.4
74.0
90.0
19.9
16.4
3.8
3.2
17.0
17.2
-
-
FMCG
Akzo Nobel India
Neutral
1,966
-
9,431
2,955
3,309
13.3
13.7
57.2
69.3
34.4
28.4
11.2
9.4
32.7
33.3
3.0
2.6
Asian Paints
Neutral
1,147
-
110,044
17,128
18,978
16.8
16.4
19.1
20.7
60.1
55.4
20.9
19.7
34.8
35.5
6.3
5.7
Britannia
Neutral
3,735
-
44,826
9,594
11,011
14.6
14.9
80.3
94.0
46.5
39.7
19.1
14.8
41.2
-
4.5
3.9
Colgate
Neutral
994
-
27,037
4,605
5,149
23.4
23.4
23.8
26.9
41.8
37.0
23.1
18.1
64.8
66.8
5.8
5.2
Dabur India
Accumulate
277
304
48,706
8,315
9,405
19.8
20.7
8.1
9.2
34.1
30.1
9.5
7.9
31.6
31.0
5.5
4.8
GlaxoSmith Con*
Neutral
5,287
-
22,236
4,350
4,823
21.2
21.4
179.2
196.5
29.5
26.9
7.8
6.6
27.1
26.8
4.5
4.0
Stock Watch
May 16, 2017
Company Name
Reco
CMP
Target
Mkt Cap
Sales ( Čcr )
OPM(%)
EPS (Č)
PER(x)
P/BV(x)
RoE(%)
EV/Sales(x)
(Č)
Price ( Č)
( Č cr )
FY17E FY18E
FY17E
FY18E
FY17E
FY18E
FY17E
FY18E
FY17E
FY18E
FY17E
FY18E
FY17E
FY18E
FMCG
Godrej Consumer
Neutral
1,926
-
65,612
10,235
11,428
18.4
18.6
41.1
44.2
46.9
43.6
10.4
8.8
24.9
24.8
6.5
5.8
HUL
Neutral
983
-
212,658
35,252
38,495
17.8
17.8
20.7
22.4
47.6
43.9
45.5
39.0
95.6
88.9
5.9
5.4
ITC
Neutral
277
-
336,908
40,059
44,439
38.3
39.2
9.0
10.1
30.9
27.4
8.6
7.5
27.8
27.5
7.9
7.1
Marico
Neutral
309
-
39,914
6,430
7,349
18.8
19.5
6.4
7.7
48.3
40.2
14.6
12.3
33.2
32.5
6.0
5.2
Nestle*
Neutral
6,611
-
63,744
10,073
11,807
20.7
21.5
124.8
154.2
53.0
42.9
21.8
19.6
34.8
36.7
6.1
5.2
Procter & Gamble
Neutral
8,091
-
26,265
2,939
3,342
23.2
23.0
146.2
163.7
55.3
49.4
14.0
11.6
25.3
23.5
8.5
7.4
Hygiene
Tata Global
Neutral
155
-
9,757
8,675
9,088
9.8
9.8
7.4
8.2
20.9
18.9
1.7
1.6
7.9
8.1
1.0
1.0
IT
HCL Tech^
Buy
851
1,014
121,472
46,723
52,342
22.1
20.9
60.0
62.8
14.2
13.6
3.6
3.0
25.3
22.4
2.3
2.0
Infosys
Buy
952
1,179
218,658
68,484
73,963
26.0
26.0
63.0
64.0
15.1
14.9
3.2
2.9
20.8
19.7
2.9
2.5
TCS
Accumulate
2,364
2,651
465,888
117,966
127,403
27.5
27.6
134.3
144.5
17.6
16.4
5.2
4.9
29.8
29.7
3.6
3.4
Tech Mahindra
Buy
443
600
43,122
29,673
32,937
15.5
17.0
32.8
39.9
13.5
11.1
2.7
2.3
19.6
20.7
1.2
1.0
Wipro
Accumulate
506
570
123,132
55,421
58,536
20.3
20.3
35.1
36.5
14.4
13.9
2.5
2.1
19.2
14.6
1.6
1.4
Media
D B Corp
Neutral
361
-
6,646
2,297
2,590
27.4
28.2
21.0
23.4
17.2
15.4
4.0
3.5
23.7
23.1
2.7
2.3
Hindustan Media
Neutral
279
-
2,051
1,016
1,138
24.3
25.2
27.3
30.1
10.2
9.3
1.9
1.7
16.2
15.8
1.3
1.2
Ventures
HT Media
Neutral
84
-
1,961
2,693
2,991
12.6
12.9
7.9
9.0
10.7
9.4
0.9
0.8
7.8
8.3
0.3
0.2
Jagran Prakashan
Buy
194
225
6,327
2,355
2,635
28.0
28.0
10.8
12.5
17.9
15.5
3.9
3.4
21.7
21.7
2.7
2.4
Sun TV Network
Neutral
912
-
35,948
2,850
3,265
70.1
71.0
26.2
30.4
34.8
30.0
8.9
7.9
24.3
25.6
12.2
10.5
TV Today Network
Buy
269
344
1,606
567
645
26.7
27.0
15.4
18.1
17.5
14.9
2.6
2.3
14.9
15.2
2.4
2.0
Metals & Mining
Coal India
Neutral
278
-
172,349
84,638
94,297
21.4
22.3
24.5
27.1
11.3
10.3
4.7
4.5
42.6
46.0
1.5
1.4
Hind. Zinc
Neutral
257
-
108,443
14,252
18,465
55.9
48.3
15.8
21.5
16.2
11.9
2.7
2.3
17.0
20.7
7.6
5.9
Hindalco
Neutral
198
-
44,507
107,899
112,095
7.4
8.2
9.2
13.0
21.6
15.3
1.0
1.0
4.8
6.6
0.9
0.9
JSW Steel
Neutral
202
-
48,792
53,201
58,779
16.1
16.2
130.6
153.7
1.6
1.3
0.2
0.2
14.0
14.4
1.7
1.5
NMDC
Neutral
129
-
40,656
6,643
7,284
44.4
47.7
7.1
7.7
18.1
16.7
1.6
1.5
8.8
9.2
3.9
3.5
SAIL
Neutral
62
-
25,524
47,528
53,738
(0.7)
2.1
(1.9)
2.6
23.8
0.7
0.6
(1.6)
3.9
1.4
1.3
Tata Steel
Neutral
456
-
44,263
121,374
121,856
7.2
8.4
18.6
34.3
24.5
13.3
1.5
1.4
6.1
10.1
1.0
1.0
Vedanta
Neutral
241
-
89,547
71,744
81,944
19.2
21.7
13.4
20.1
18.0
12.0
1.5
1.4
8.4
11.3
1.6
1.3
Oil & Gas
Cairn India
#VALUE!
9,127
10,632
4.3
20.6
8.8
11.7
3.3
4.2
GAIL
Neutral
414
-
69,944
56,220
65,198
9.3
10.1
27.1
33.3
15.3
12.4
1.4
1.3
9.3
10.7
1.4
1.2
Indian Oil Corp
Neutral
442
-
214,680
373,359
428,656
5.9
5.5
54.0
59.3
8.2
7.5
1.3
1.1
16.0
15.6
0.7
0.6
Stock Watch
May 16, 2017
Company Name
Reco
CMP
Target
Mkt Cap
Sales ( Čcr )
OPM(%)
EPS (Č)
PER(x)
P/BV(x)
RoE(%)
EV/Sales(x)
(Č)
Price ( Č)
( Č cr )
FY17E FY18E
FY17E
FY18E
FY17E
FY18E
FY17E
FY18E
FY17E
FY18E
FY17E
FY18E
FY17E
FY18E
Oil & Gas
ONGC
Neutral
187
-
239,853
137,222
152,563
15.0
21.8
19.5
24.1
9.6
7.8
0.8
0.8
8.5
10.1
2.0
1.8
Reliance Industries
Neutral
1,344
-
436,865
301,963
358,039
12.1
12.6
87.7
101.7
15.3
13.2
1.6
1.4
10.7
11.3
1.9
1.6
Pharmaceuticals
Alembic Pharma
Accumulate
600
648
11,313
3,101
3,966
19.7
20.5
21.4
25.5
28.0
23.5
6.0
4.9
23.0
22.8
3.6
2.7
Alkem Laboratories Ltd
Buy
1,916
2,257
22,910
6,065
7,009
18.7
20.0
80.2
92.0
23.9
20.8
5.4
4.5
22.5
21.6
3.7
3.2
Aurobindo Pharma
Buy
614
877
35,956
15,720
18,078
23.7
23.7
41.4
47.3
14.8
13.0
3.9
3.0
29.6
26.1
2.5
2.2
Aventis*
Neutral
4,201
-
9,675
2,206
2,508
16.6
16.8
128.9
139.9
32.6
30.0
5.6
4.4
21.6
23.5
4.2
3.5
Cadila Healthcare
Neutral
488
-
49,938
10,429
12,318
17.7
21.6
13.1
19.2
37.2
25.4
7.8
6.2
22.8
27.1
4.8
4.0
Cipla
Sell
566
465
45,558
15,378
18,089
15.7
16.8
19.3
24.5
29.3
23.1
3.4
3.0
12.3
13.9
3.1
2.6
Dishman Pharma
Sell
305
143
4,923
1,718
1,890
22.7
22.8
9.5
11.3
32.1
27.0
3.1
2.8
10.1
10.9
3.3
2.9
Dr Reddy's
Neutral
2,676
-
44,337
16,043
18,119
18.0
23.0
78.6
130.9
34.1
20.4
3.3
2.9
10.1
15.2
2.5
2.4
GSK Pharma*
Neutral
2,428
-
20,562
2,800
3,290
10.2
20.6
32.2
60.3
75.4
40.3
14.0
13.8
17.2
34.5
7.1
6.1
Indoco Remedies
Accumulate
222
240
2,041
1,112
1,289
16.2
18.2
11.6
16.0
19.1
13.8
3.1
2.6
17.0
20.1
2.0
1.6
Ipca labs
Accumulate
557
613
7,022
3,258
3,747
12.8
15.3
12.1
19.2
46.0
29.0
2.9
2.6
6.4
9.5
2.3
2.0
Lupin
Buy
1,284
1,809
58,001
15,912
18,644
26.4
26.7
58.1
69.3
22.1
18.5
4.3
3.5
21.4
20.9
3.7
3.0
Natco Pharma
Neutral
934
-
16,286
2,090
2,335
32.1
26.6
26.8
23.2
34.8
40.3
9.9
8.5
28.4
21.1
7.9
96.5
Sun Pharma
Buy
653
847
156,550
31,129
35,258
32.0
32.9
30.2
35.3
21.6
18.5
3.5
2.9
20.0
20.1
4.6
3.9
Power
NTPC
Neutral
160
-
131,721
86,605
95,545
17.5
20.8
11.8
13.4
13.5
11.9
1.4
1.3
10.5
11.1
2.9
2.9
Power Grid
Accumulate
207
223
108,111
25,315
29,193
88.2
88.7
14.2
17.2
14.6
12.0
2.2
1.9
15.2
16.1
8.9
8.0
Tata Power
Neutral
84
-
22,598
36,916
39,557
17.4
27.1
5.1
6.3
16.4
13.3
1.4
1.3
9.0
10.3
1.6
1.5
Real Estate
MLIFE
Buy
449
522
2,307
1,152
1,300
22.7
24.6
29.9
35.8
15.0
12.6
1.1
1.1
7.6
8.6
2.7
2.3
Prestige Estate
Neutral
237
-
8,884
4,707
5,105
25.2
26.0
10.3
13.0
23.0
18.2
1.8
1.7
10.3
10.2
3.1
2.7
Telecom
Bharti Airtel
Neutral
364
-
145,445
105,086
114,808
34.5
34.7
12.2
16.4
29.8
22.2
2.0
1.9
6.8
8.4
2.3
2.0
Idea Cellular
Neutral
86
-
30,956
40,133
43,731
37.2
37.1
6.4
6.5
13.4
13.2
1.1
1.0
8.2
7.6
1.8
1.5
zOthers
Abbott India
Neutral
4,199
-
8,923
3,153
3,583
14.1
14.4
152.2
182.7
27.6
23.0
135.5
115.7
25.6
26.1
2.5
2.2
Asian Granito
Neutral
386
-
1,161
1,060
1,169
12.2
12.5
12.7
15.9
30.5
24.3
2.9
2.6
9.5
10.7
1.4
1.2
Bajaj Electricals
Buy
340
395
3,447
4,801
5,351
5.7
6.2
10.4
13.7
32.7
24.9
4.0
3.6
12.4
14.5
0.7
0.6
Banco Products (India)
Neutral
247
-
1,763
1,353
1,471
12.3
12.4
14.5
16.3
17.0
15.1
23.5
21.2
14.5
14.6
1.2
133.9
Coffee Day Enterprises
Neutral
262
-
5,407
2,964
3,260
20.5
21.2
4.7
8.0
-
32.8
3.0
2.8
5.5
8.5
2.2
2.0
Ltd
Competent Automobiles Neutral
222
-
142
1,137
1,256
3.1
2.7
28.0
23.6
7.9
9.4
42.7
38.6
14.3
11.5
0.1
0.1
Stock Watch
May 16, 2017
Company Name
Reco
CMP
Target
Mkt Cap
Sales ( Čcr )
OPM(%)
EPS (Č)
PER(x)
P/BV(x)
RoE(%)
EV/Sales(x)
(Č)
Price ( Č)
( Č cr )
FY17E
FY18E
FY17E
FY18E
FY17E
FY18E
FY17E
FY18E
FY17E
FY18E
FY17E
FY18E
FY17E
FY18E
zOthers
Elecon Engineering
Neutral
61
-
686
1,482
1,660
13.7
14.5
3.9
5.8
15.7
10.5
3.7
3.4
7.8
10.9
0.8
0.7
Finolex Cables
Neutral
538
-
8,227
2,883
3,115
12.0
12.1
14.2
18.6
37.9
28.9
20.2
17.6
15.8
14.6
2.5
2.3
Garware Wall Ropes
Neutral
805
-
1,762
863
928
15.1
15.2
36.4
39.4
22.1
20.4
4.0
3.4
17.5
15.9
2.0
1.8
Goodyear India*
Neutral
840
-
1,938
1,598
1,704
10.4
10.2
49.4
52.6
17.0
16.0
78.5
68.9
18.2
17.0
0.9
127.4
Hitachi
Neutral
1,867
-
5,076
2,081
2,433
8.8
8.9
33.4
39.9
55.9
46.8
45.1
37.6
22.1
21.4
2.4
2.1
HSIL
Neutral
343
-
2,482
2,384
2,515
15.8
16.3
15.3
19.4
22.4
17.7
22.3
19.2
7.8
9.3
1.2
1.1
Interglobe Aviation
Neutral
1,111
-
40,174
21,122
26,005
14.5
27.6
110.7
132.1
10.0
8.4
60.1
42.9
168.5
201.1
1.9
1.5
Jyothy Laboratories
Neutral
384
-
6,974
1,440
2,052
11.5
13.0
8.5
10.0
45.2
38.4
10.9
10.1
18.6
19.3
5.1
3.6
Kirloskar Engines India
Neutral
396
-
5,727
2,554
2,800
9.9
10.0
10.5
12.1
37.7
32.7
15.8
14.9
10.7
11.7
1.9
1.7
Ltd
Linc Pen & Plastics
Neutral
286
-
423
382
420
9.3
9.5
13.5
15.7
21.2
18.2
3.6
3.1
17.1
17.3
1.2
1.1
M M Forgings
Neutral
638
-
770
546
608
20.4
20.7
41.3
48.7
15.5
13.1
87.4
77.4
16.6
17.0
1.3
1.1
Manpasand Bever.
Neutral
775
-
4,431
836
1,087
19.6
19.4
16.9
23.8
45.8
32.5
5.5
4.8
12.0
14.8
5.0
3.8
Mirza International
Neutral
136
-
1,633
963
1,069
17.2
18.0
6.1
7.5
22.2
18.1
3.4
2.9
15.0
15.7
1.9
1.7
MT Educare
Neutral
79
-
315
366
417
17.7
18.2
9.4
10.8
8.5
7.3
1.9
1.6
22.2
22.3
0.8
0.7
Narayana Hrudaya
Neutral
304
-
6,213
1,873
2,166
11.5
11.7
2.6
4.0
114.9
76.7
7.1
6.4
6.1
8.3
3.4
2.9
Navkar Corporation
Buy
230
265
3,283
369
561
42.9
42.3
6.9
11.5
33.3
20.0
2.3
2.1
7.4
10.5
9.9
6.5
Navneet Education
Neutral
165
-
3,844
1,062
1,147
24.0
24.0
6.1
6.6
27.0
24.9
5.6
4.9
20.6
19.8
3.7
3.4
Nilkamal
Neutral
2,078
-
3,101
1,995
2,165
10.7
10.4
69.8
80.6
29.8
25.8
118.8
103.2
16.6
16.5
1.5
1.4
Page Industries
Neutral
15,434
-
17,215
2,450
3,124
20.1
17.6
299.0
310.0
51.6
49.8
343.7
262.4
47.1
87.5
7.1
5.6
Parag Milk Foods
Neutral
250
-
2,101
1,919
2,231
9.3
9.6
9.5
12.9
26.4
19.3
4.1
3.4
15.5
17.5
1.2
1.1
Quick Heal
Neutral
233
-
1,636
408
495
27.3
27.0
7.7
8.8
30.2
26.5
2.8
2.8
9.3
10.6
3.2
2.6
Radico Khaitan
Accumulate
129
147
1,711
1,667
1,824
13.0
13.2
6.7
8.2
19.3
15.7
1.8
1.6
9.0
10.2
1.4
1.3
Relaxo Footwears
Neutral
473
-
5,682
2,085
2,469
9.2
8.2
7.6
8.0
62.6
59.5
24.3
20.7
17.9
18.8
2.8
2.4
S H Kelkar & Co.
Neutral
291
-
4,211
1,036
1,160
15.1
15.0
6.1
7.2
47.7
40.6
5.1
4.7
10.7
11.5
3.9
3.5
Siyaram Silk Mills
Accumulate
1,707
1,872
1,600
1,652
1,857
11.6
11.7
92.4
110.1
18.5
15.5
2.7
2.4
14.7
15.2
1.2
1.0
Styrolution ABS India*
Neutral
720
-
1,266
1,440
1,537
9.2
9.0
40.6
42.6
17.7
16.9
45.3
41.2
12.3
11.6
0.8
0.7
Surya Roshni
Neutral
273
-
1,197
3,342
3,625
7.8
7.5
17.3
19.8
15.8
13.8
30.0
24.1
10.5
10.8
0.6
0.6
Team Lease Serv.
Neutral
1,142
-
1,952
3,229
4,001
1.5
1.8
22.8
32.8
50.2
34.8
5.4
4.7
10.7
13.4
0.5
0.4
The Byke Hospitality
Neutral
198
-
792
287
384
20.5
20.5
7.6
10.7
26.0
18.5
5.4
4.4
20.7
23.5
2.8
2.1
Stock Watch
May 16, 2017
Company Name
Reco
CMP
Target Mkt Cap
Sales ( Čcr )
OPM(%)
EPS (Č)
PER(x)
P/BV(x)
RoE(%)
EV/Sales(x)
(Č)
Price ( Č)
( Č cr )
FY17E FY18E FY17E FY18E FY17E FY18E FY17E FY18E FY17E FY18E FY17E FY18E FY17E FY18E
zOthers
Transport Corporation of
Neutral
254
-
1,946
2,671
2,911
8.5
8.8
13.9
15.7
18.3
16.2
2.5
2.2
13.7
13.8
0.8
0.8
India
TVS Srichakra
Neutral
4,047
-
3,099
2,304
2,614
13.7
13.8
231.1
266.6
17.5
15.2
454.7
358.0
33.9
29.3
1.3
1.2
UFO Moviez
Neutral
429
-
1,185
619
685
33.2
33.4
30.0
34.9
14.3
12.3
2.0
1.7
13.8
13.9
1.6
1.3
Visaka Industries
Neutral
354
-
561
1,051
1,138
10.3
10.4
21.0
23.1
16.8
15.3
45.3
42.4
9.0
9.2
0.8
0.8
VRL Logistics
Neutral
326
-
2,975
1,902
2,119
16.7
16.6
14.6
16.8
22.4
19.4
4.9
4.3
21.9
22.2
1.7
1.5
Wonderla Holidays
Neutral
384
-
2,172
287
355
38.0
40.0
11.3
14.2
34.0
27.1
4.9
4.3
21.4
23.9
7.3
5.9
VIP Industries
Accumulate
199
218
2,815
1,270
1,450
10.4
10.4
5.6
6.5
35.6
30.7
7.4
6.4
20.7
21.1
2.2
1.9
Navin Fluorine
Buy
2,976
3,650
2,913
789
945
21.1
22.4
120.1
143.4
24.8
20.8
4.0
3.4
17.8
18.5
3.6
2.9
Source: Company, Angel Research; Note: *December year end; #September year end; &October year end; Price as on May 15, 2017
Market Outlook
May 16, 2017
Research Team Tel: 022 - 39357800
DISCLAIMER
Angel Broking Private Limited (hereinafter referred to as “Angel”) is a registered Member of National Stock Exchange of India
Limited,Bombay Stock Exchange Limited and Metropolitan Stock Exchange Limited. It is also registered as a Depository Participant with
CDSL and Portfolio Manager with SEBI. It also has registration with AMFI as a Mutual Fund Distributor. Angel Broking Private Limited is a
registered entity with SEBI for Research Analyst in terms of SEBI (Research Analyst) Regulations, 2014 vide registration number
INH000000164. Angel or its associates has not been debarred/ suspended by SEBI or any other regulatory authority for accessing
/dealing in securities Market. Angel or its associates/analyst has not received any compensation / managed or
co-managed public offering of securities of the company covered by Analyst during the past twelve months.
This document is solely for the personal information of the recipient, and must not be singularly used as the basis of any investment
decision. Nothing in this document should be construed as investment or financial advice. Each recipient of this document should make
such investigations as they deem necessary to arrive at an independent evaluation of an investment in the securities of the companies
referred to in this document (including the merits and risks involved), and should consult their own advisors to determine the merits and
risks of such an investment.
Reports based on technical and derivative analysis center on studying charts of a stock's price movement, outstanding positions and
trading volume, as opposed to focusing on a company's fundamentals and, as such, may not match with a report on a company's
fundamentals. Investors are advised to refer the Fundamental and Technical Research Reports available on our website to evaluate the
contrary view, if any.
The information in this document has been printed on the basis of publicly available information, internal data and other reliable
sources believed to be true, but we do not represent that it is accurate or complete and it should not be relied on as such, as this
document is for general guidance only. Angel Broking Pvt. Limited or any of its affiliates/ group companies shall not be in any way
responsible for any loss or damage that may arise to any person from any inadvertent error in the information contained in this report.
Angel Broking Pvt. Limited has not independently verified all the information contained within this document. Accordingly, we cannot
testify, nor make any representation or warranty, express or implied, to the accuracy, contents or data contained within this document.
While Angel Broking Pvt. Limited endeavors to update on a reasonable basis the information discussed in this material, there may be
regulatory, compliance, or other reasons that prevent us from doing so.
This document is being supplied to you solely for your information, and its contents, information or data may not be reproduced,
redistributed or passed on, directly or indirectly.
Neither Angel Broking Pvt. Limited, nor its directors, employees or affiliates shall be liable for any loss or damage that may arise from
or in connection with the use of this information.